




The function can be used by patients who are participating in the NfL ALS study and APST at the same time. Parallel participation in APST is necessary for the notification of results, as the ALS app is not a formal part of the “NfL in ALS” study.
How are the NfL analysis results presented?
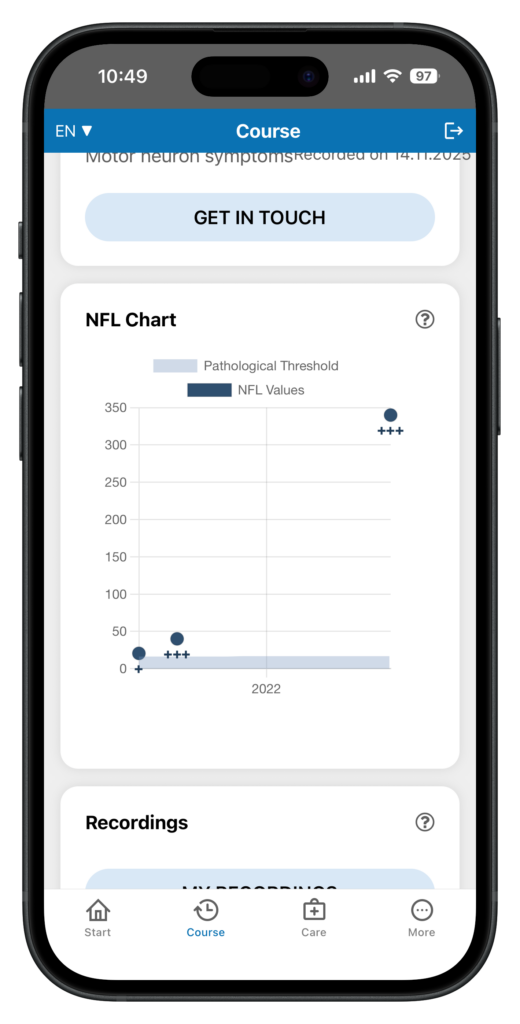
The NfL analysis results are displayed in a diagram in the APST portal and in the ALS app. In the ALS app, the NfL diagram can be found on the “Course” page – below the ALSFRS history diagram. The NfL analysis is not carried out continuously as in a “routine laboratory”, but as part of a scientific project. For this purpose, samples from different ALS centers are collected (“pooling”) and thus analyzed with a delay. Once the analysis and data processing have been completed, the data for those patients for whom a declaration of consent for APST is available is displayed in the ALS app.
What should I bear in mind when reporting NfL results?
For patients participating in the ALS-NfL study, expert medical interpretation of the findings is essential due to the open research questions. Various medical factors must be taken into account. The NfL value is therefore assessed in personal doctor-patient contact at an NfL study center.
NfL Progression Chart
NfL chart
The NfL diagram in the ALS app. The normal range of NfL serum concentrations is shown in color (light blue). The steps in the normal range result from the age-dependent increase in NfL serum concentrations. The level of the NfL serum concentration (in picograms per milliliter, pg/mL) can be read off the left-hand scale
Age-dependent normal range
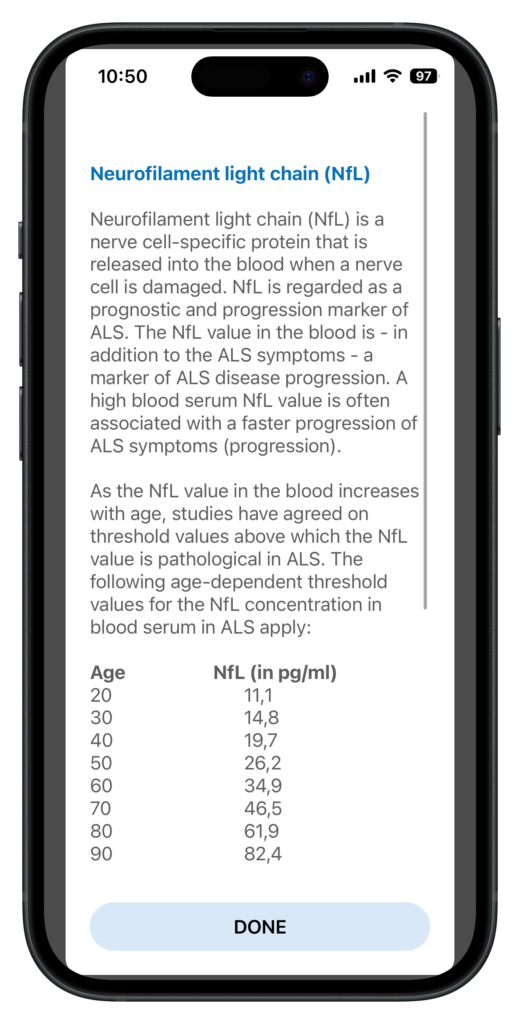
NfL can also be detected at lower concentrations in healthy people. However, the NfL value increases in the course of life – even in healthy people. The normal range of NfL serum concentrations is described in the info text behind the ?-symbol.